
Most fleet reports tell you what happened. Ours tell you what to do about it. We take the live data from every vehicle in your fleet and turn it into clear, actionable insights.
If your reporting cannot answer these five questions clearly, it’s not working hard enough. Every report we deliver is built around them.
Are we paying for more than we need?
Are our drivers and assets safe?
Are our vehicles compliant and available?
When should vehicles be replaced?
Are we on budget?
Not just where your vehicles are. What they’re doing, what they’re costing, and whether your fleet is safe and compliant.
We don’t just send you a spreadsheet and leave you to work it out. Here are some examples of how we translate raw fleet data into smart, actionable decisions for our clients.
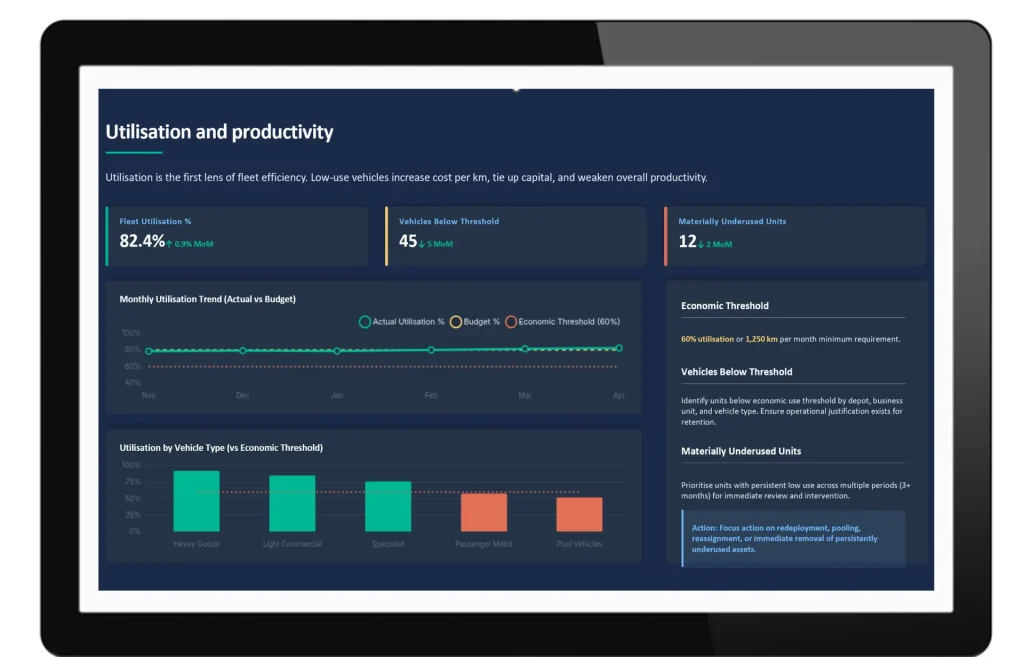
Underutilised assets are identified through low mileage and high idle time.
The business is paying for assets that are not contributing to operations.
Initiate vehicle redeployment, reassignment, or immediate sale to reduce overheads
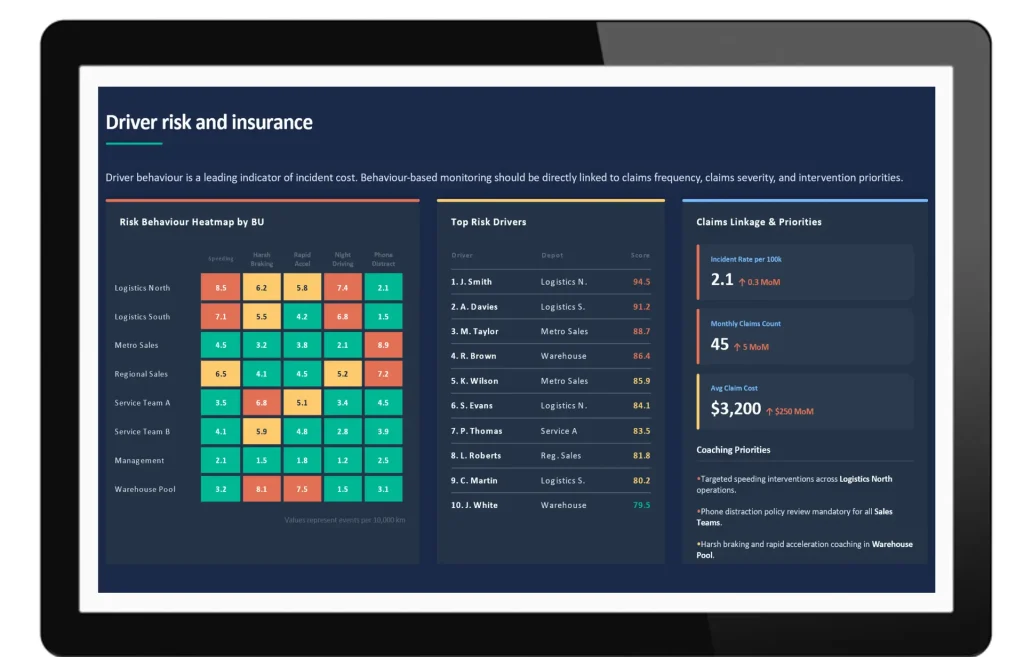
Driver scores show a spike in speeding, harsh braking, and mobile phone use.
These specific behaviours represent a high-frequency risk for incidents and claims.
Trigger targeted coaching videos and a mandatory review of the mobile phone policy.
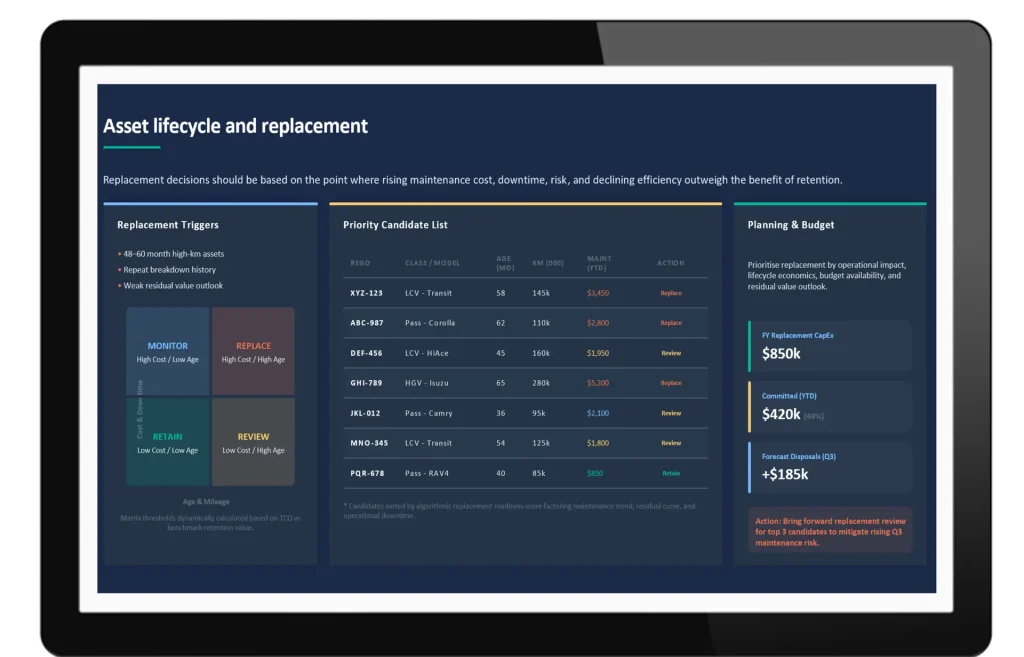
Maintenance costs and downtime are rising sharply across three specific assets.
These vehicles have reached a point where repair costs outweigh their operational value.
Initiate a review to exit the assets before further depreciation or failure.
A good fleet report covers asset utilisation, total cost of ownership per vehicle, fuel use, maintenance and repair costs, driver risk, claims, incidents and compliance. It should also answer five questions. Are we paying for more than we need? Where is risk concentrated? Are our vehicles compliant and available? When should vehicles be replaced? Are we on budget and on forecast? Every report we deliver is built around them.
Yes. For your vehicles, we track servicing, tyres, and maintenance and roadworthiness history, and manage registration and insurance renewal alerts so nothing lapses. For tax, we provide ATO-compliant fringe benefits tax logbooks. For safety, telematics and driver coaching help promote safer driving and reduce liability. Your account manager flags anything that needs attention.
Monthly reports are delivered automatically. For clients who want live visibility, your account manager has access to the same data in real time to answer questions as they arise.
Yes. We structure reporting around the reader, with operational detail for day-to-day management and cost summaries for leadership and finance teams.
Your account manager will flag the issue and recommend a response. In many cases, we will have already initiated the action before you even see the report.
Absolutely. In addition to the reports we deliver, clients can be given direct access to the live fleet management platform to view their data at any time. For businesses that want to pipe raw fleet data directly into their own internal systems or data lake, this is available through our Data Integration add-on service .
We use real-time telematics to show how your vehicles are actually being used, so you’re not relying on guesswork. We look at engine runtime, daily mileage, trip frequency and idle time to find underused vehicles and spot where the fleet can be right-sized. Those vehicles can then be redeployed, reassigned or sold. The aim is simple: every vehicle in your fleet should earn its keep.
We’ll show you exactly what your fleet data looks like when it’s organised, actionable, and tailored to your business.